Never has an inquiry into the skyrocketing price of homes been more urgent.Rarely has one been as insultingly ill-suited as the one under way right now.
Midway through last year in the midst of COVID, the average forecast of the 22 leading economists who took part in The Conversation mid-year survey was for no increase in home prices whatsoever in the year ahead (actually for slight falls).
At that time the typical (median) Sydney house price was A$1 million, where it stayed until the end of the year.
Get news curated by experts, not algorithms.
Then it took off. In the ten months to the start of this month the typical Sydney house price soared $300,000 to $1.3 million – a breathtaking increase (and an awfully big penalty for delaying buying) of $1,000 each day.
For apartments, the increase isn’t as big, although still extraordinary. The cost of delaying buying a typical Sydney apartment has been $334 each day.
The cost of delaying buying a typical Melbourne house has been close to $600 per day, the cost of delaying buying a typical Melbourne apartment $150 per day.
In that time, in the year in which the typical Australian home price climbed 20.3%, the typical Australian wage climbed just 1.7%
What people stretched to the limit or now locked out of the housing market are desperate to know is
- why it is happening
- when it is likely to stop
- what (if anything) we can do about it.
Instead, we have been given an inquiry into affordability in name only. Seriously. The parliamentary inquiry commissioned by the treasurer in July and chaired by backbencher Jason Falinski is called an inquiry into affordability and supply, but the word “affordability” appears in none of its three terms of reference.
It’s an inquiry into ‘supply’
Instead, the terms of reference refer to the impact of taxes, charges and other things settings on “housing supply”.
I guess the idea is that it is obvious that supply is the key to affordability, but it rather negates the idea of holding an inquiry, and it sits oddly with the explosion in prices we have seen in a year in which building approvals have surged by a near-record 224,000 and our population has as good as stayed still.
In its submission to the inquiry the Reserve Bank includes a graph showing the supply of housing (the stock of houses and apartments) outpacing population growth for the best part of the decade leading up to the latest price explosion.
Supply has been holding up
But in a sense (and stay with me here) whoever drafted the restricted terms of reference is right. Housing affordability is linked to the supply of housing.
And housing affordability has been doing okay.
In evidence to the inquiry last month Treasury assistant secretary John Swieringa drew a distinction between housing affordability (best measured by the cost of renting housing) and the cost of buying a house, which was partly an investment.
When you are a purchaser of a house you are partly investing in an asset and partly buying dwelling services; whereas when you are renting it’s probably a cleaner read on what cost dwelling services is.
That clean read – rent as a proportion of income – hasn’t much changed in 20 years. For middle earners it has remained comfortably between 20% and 25% of household disposable income.
Home loan payments take up less of income.
The Reserve Bank says advertised rents for units in Sydney and Melbourne have drifted down by $30 to $50 per week over the past five years while rents in other places have mostly drifted higher.
As it happens, it says another measure of housing affordability is improving.
The cost of home loan payments as a proportion of income has been falling since the onset of COVID. Dramatically lower interest rates mean payments take up less household disposable income than they did five years ago, even with the much higher prices.
The problem is accessibility
What has worsened is what the Reserve Bank calls “housing accessibility”, to distinguish it from housing affordability.
Accessibility is the ability of a first time owner or renter to get into the market at all by finding the deposit or bond.
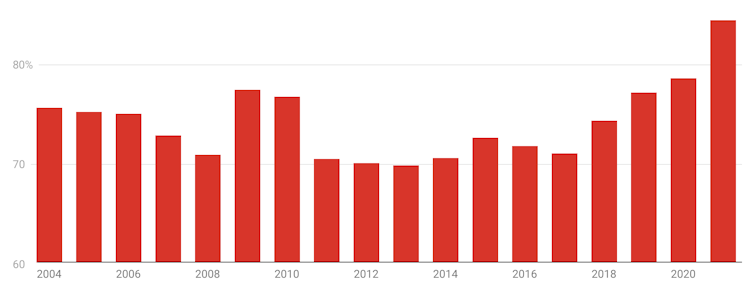
Astounding price growth and five years of weak income growth have pushed up the cost of an average first home deposit from 70% of income to more than 80%.
On average it now takes a 24-35 year old nine years of tucking away one fifth of their income each year to save for a typical Sydney deposit, up from five to six years a decade ago.
Average First Home Buyer Deposit

It’s okay if you have a parent who can get their hands on money, almost impossible if you don’t. In the words of former Reserve Bank official Peter Tulip, it’s making home ownership hereditary.
He’s not the first person to have noticed.
Liberal backbencher John Alexander chaired the Coalition’s 2015 inquiry into home ownership. He said then we were “on track to becoming a Kingdom where the Lords own all the land and the biggest Lord will be King and the enslaved serf tenant is paying rent to the Lord to become wealthier”.
Ownership is becoming hereditary
Prime Minister Turnbull and Treasurer Scott Morrison used the 2016 election (in which they attacked Labor’s plan to limit tax breaks for landlords) to shut down Alexander’s inquiry, and only agreed to restart it with someone else as chair. It had considered 30 hours of evidence.
The chair of this current (limited) inquiry seems unperturbed.
He opened September’s hearings saying no question was off-limits, no idea too stupid, all forms of inquiry were worthwhile. It’d be great if that was true.
